
Bitcoin Logs Biggest Weekly Price Gain in 3 Months as Illiquid Supply Hits Record High
Bitcoin posted its steepest weekly gain in three months last week, and blockchain data hinting at renewed supply-side weakness indicates further advances may be in the offing.
The top cryptocurrency by market cap added 12.4% in the seven days through Aug. 1, the most since the final week of April, according to Bitstamp data. It advanced 18.4% in July, snapping a three-month losing streak, and was last changing hands near $40,000.
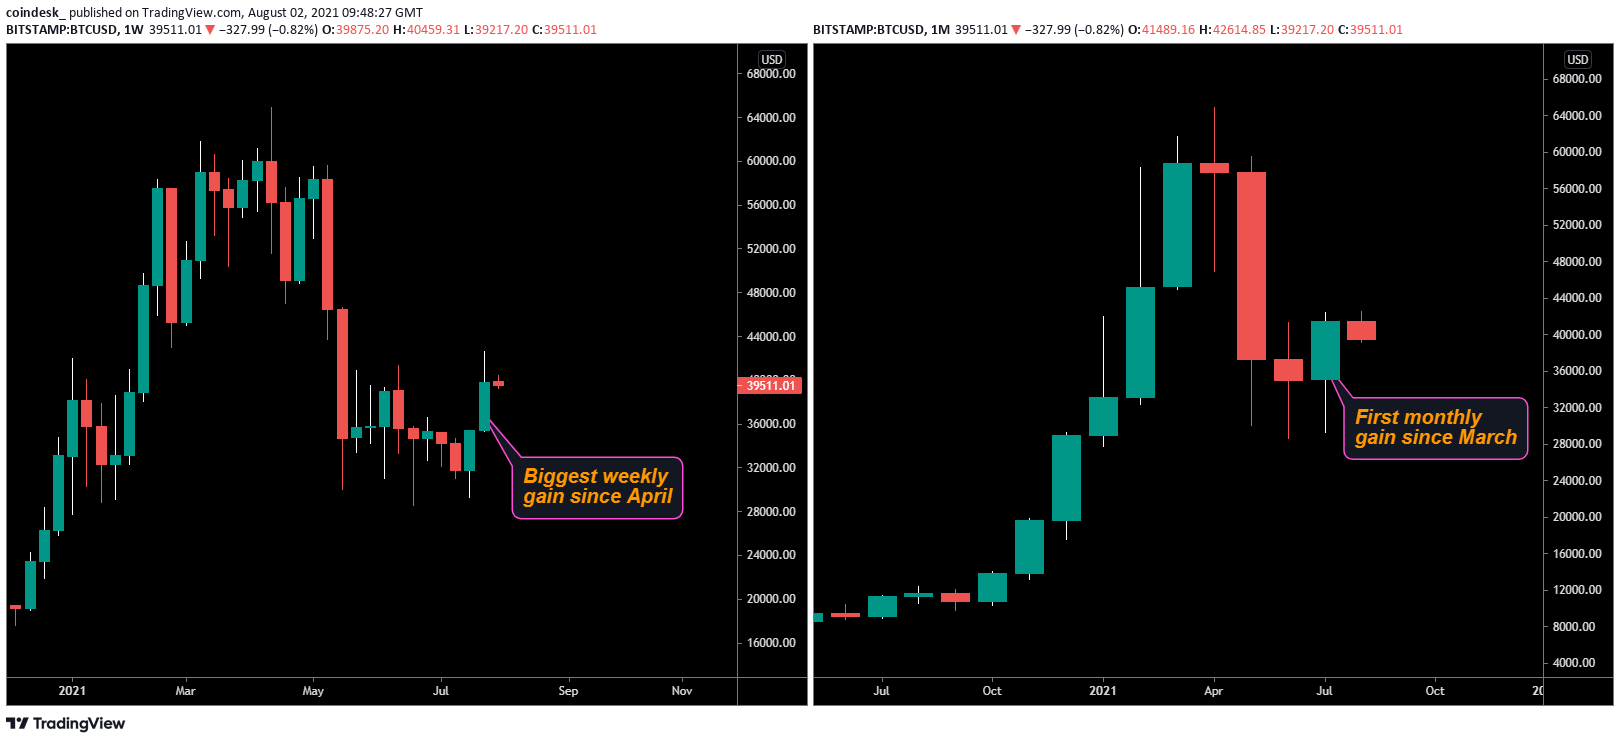
Bitcoin's weekly and monthly charts
Data tracked by Glassnode show bitcoin's illiquid supply, or the balance held by illiquid entities, decoupled from prices in May, signaling renewed holding sentiment. The measure reached a record high 14.447 million over the weekend.
"Amount of bitcoin held by the strongest holders has retraced the whole dump and surged to [all-time high]. This is very bullish," Lex Moskovski, chief investment officer at Moskovski Capital, tweeted.
The figures show investors are again holding for the long term, or HODLing, reducing the supply of coins available for sale in the market.
Bitcoin supply currently is 18.77 million, or 89% of the 21 million cap. However, according to Glassnode, the actual number of coins available for trading is much lower due to increased hoarding by investors and permanent loss of mined BTC over the years.
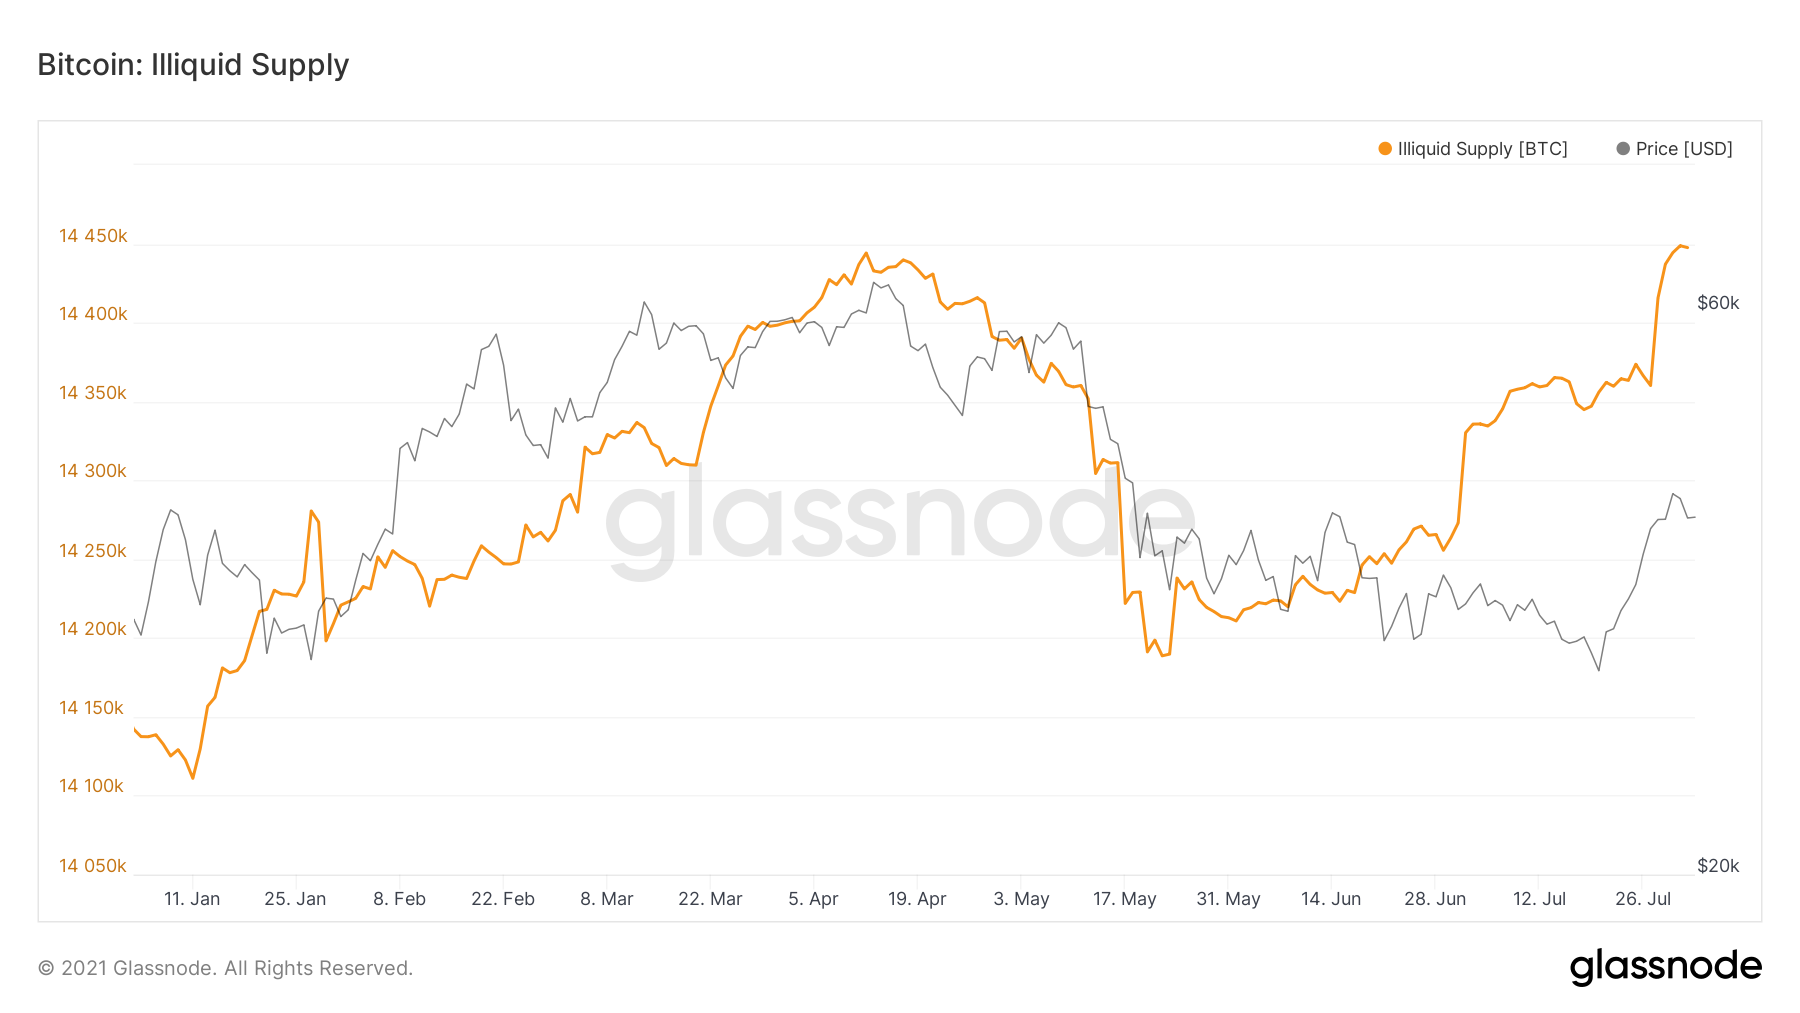
Bitcoin: Illiquid supply
While bitcoin moved in tandem with illiquid supply from October 2020 to May 2021, it diverged in mid-May. As the chart shows, the link may now be reestablishing. A similar split occurred for several weeks before bitcoin began its meteoric rise from $10,000 in October 2020. If the illiquid supply continues to rise, a supply-side crisis may emerge, and last price year's surge may be repeated.
Other blockchain indicators also signal an impending supply squeeze, as tweeted by analysts Willy Woo and Will Clemente.
From a technical analysis perspective, the bull case would strengthen once bitcoin establishes a foothold above a three-month descending trendline.
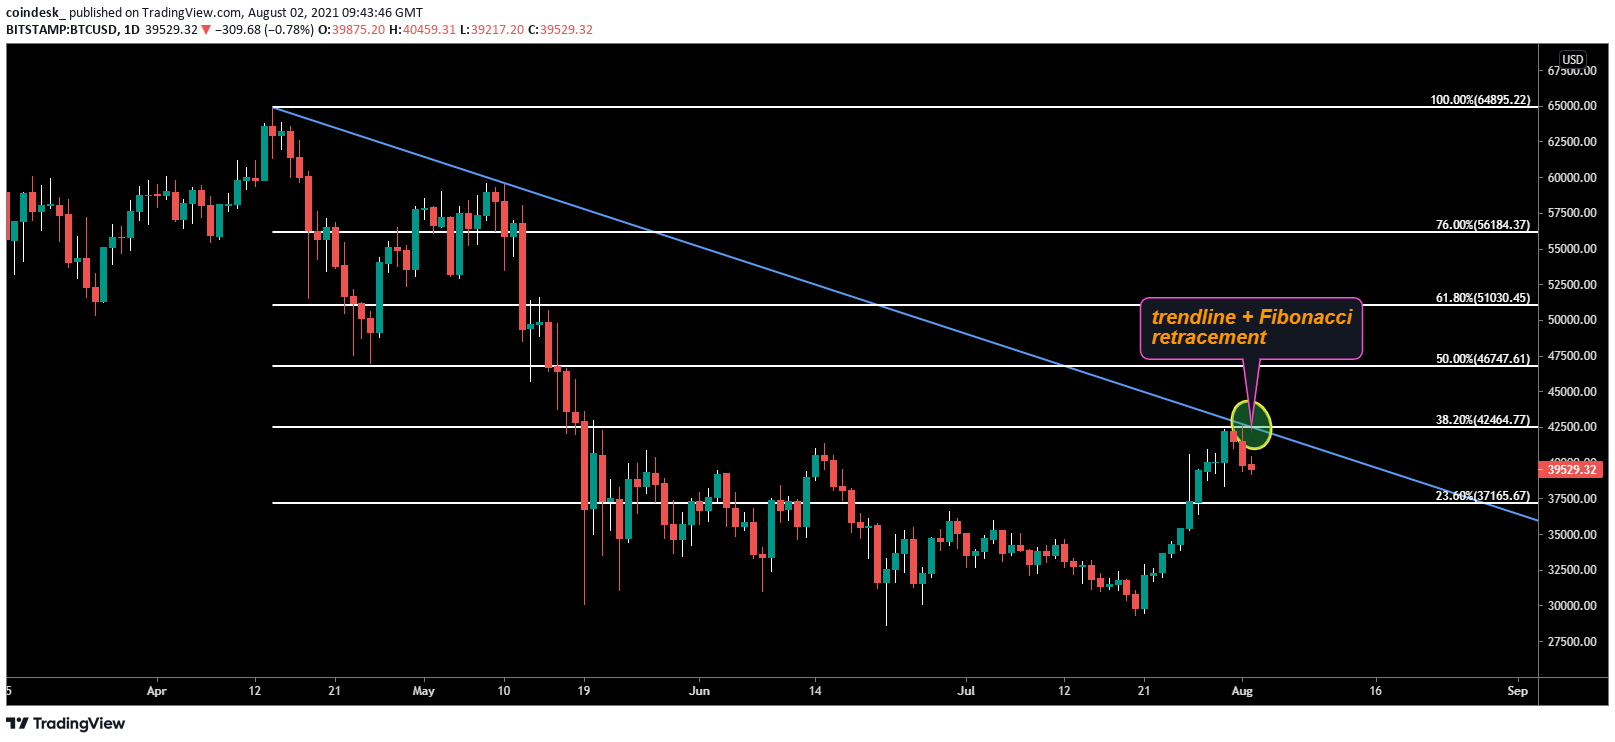
Bitcoin's daily chart
The trendline hurdle is $42,464 at press time. That's also the 38.2% Fibonacci retracement of the sell-off from April's high to May's low.
DISCLOSURE
The leader in news and information on cryptocurrency, digital assets and the future of money, CoinDesk is a media outlet that strives for the highest journalistic standards and abides by a strict set of editorial policies. CoinDesk is an independent operating subsidiary of Digital Currency Group, which invests in cryptocurrencies and blockchain startups. As part of their compensation, certain CoinDesk employees, including editorial employees, may receive exposure to DCG equity in the form of stock appreciation rights, which vest over a multi-year period. CoinDesk journalists are not allowed to purchase stock outright in DCG.
